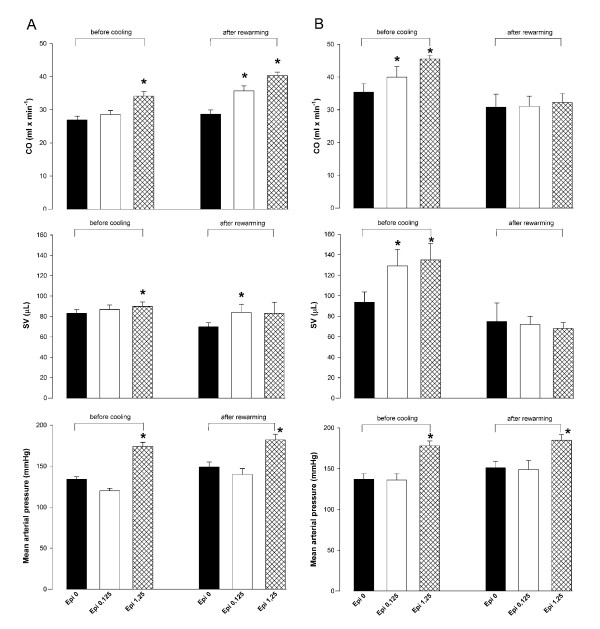
Figure 4.
Changes in cardiac output (CO), stroke volume (SV), or mean arterial pressure in response to Epi, 0.125 μg/min, or Epi, 1.25 μg/min, before cooling and after rewarming in the group receiving saline (a), or Epi (b) during cooling to 28°C. *P < 0.05 compared with corresponding baseline value.

