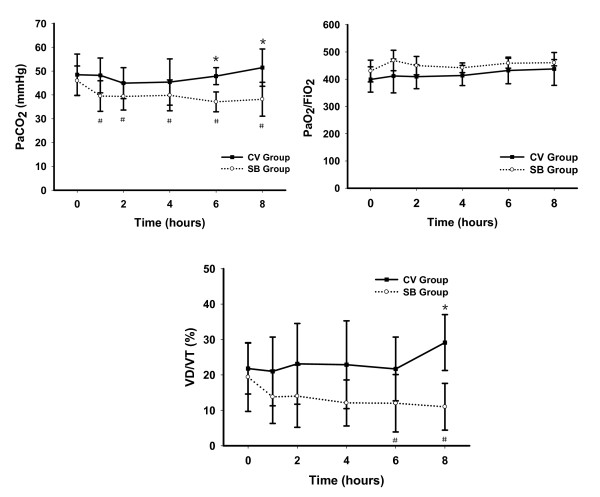
Figure 3.
Time course for PaCO2 , PaO2/FiO2 and VD/VT in experimental groups. Results are given as mean ± SD. *P < 0.05 between groups at the same time. #P < 0.05 compared with baseline within the same group. CV, control ventilation; FiO2, fraction of inspired oxygen; PaCO2, arterial partial pressure of carbon dioxide; PaO2, arterial partial pressure of oxygen; SB, spontaneous breathing; VD/VT, ratio of alveolar dead space to tidal volume.

