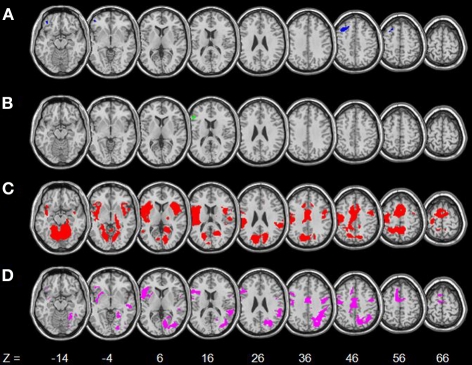
Figure 3.
Age-related changes in regional brain activations. (A) Blue: age-related decreased activations in SS > SE; (B) Green: age-related decreased activations in pGd > pGi; (C) Red: age-related increased activations in SE > SS; (D) Magenta: age-related increased activations in SE > GS. Numbers at the bottom indicate the positions in the z-axis in the MNI coordinate. Neurological orientation: right = right.

