
Figure 1.
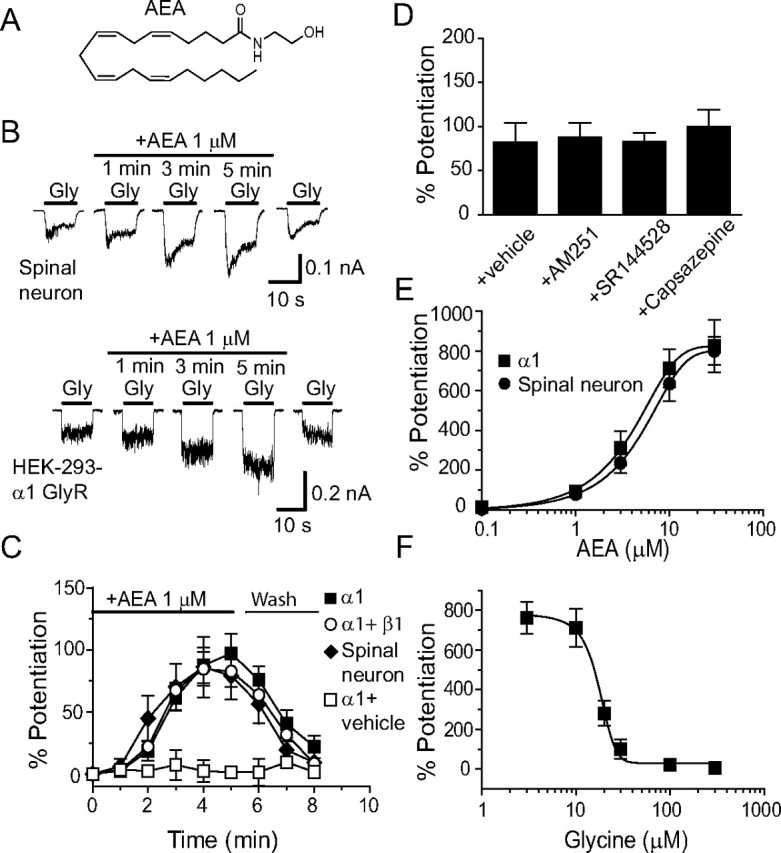
AEA potentiation of IGly in cultured spinal neurons and HEK-293 cells expressing α1 and β1 GlyRs. A, Chemical structure of AEA. B, Current traces showing IGly activated by EC2 concentrations of Gly (5–10 μm) before, during and after a 5 min continuous incubation with AEA in cultured spinal neurons (top) and in HEK-293 cells expressing the α1 GlyR subunits (bottom). C, Time courses of average percentage potentiation induced by 1 μm AEA during a 5 min period of continuous incubation. The solid bar indicates AEA application time in cultured neurons (solid diagonals) and in HEK-293 cells expressing α1 GlyRs (solid squares) and α1β1 GlyRs (open circles). Each point represents mean ± SE of at least 6 cells. D, Effects of AM251, SR144528 and capsazepine on AEA potentiation (n = 5–7). E, The concentration–response curve of the AEA-induced potentiation in cultured neurons (n = 6) and HEK-293 cells expressing the α1 subunit (n = 6). F, Agonist concentration dependence of AEA-induced potentiation of IGly in HEK-293 cells expressing the α1 subunits (n = 5). The error bars that are not visible are smaller than the size of symbols.