
Figure 5.
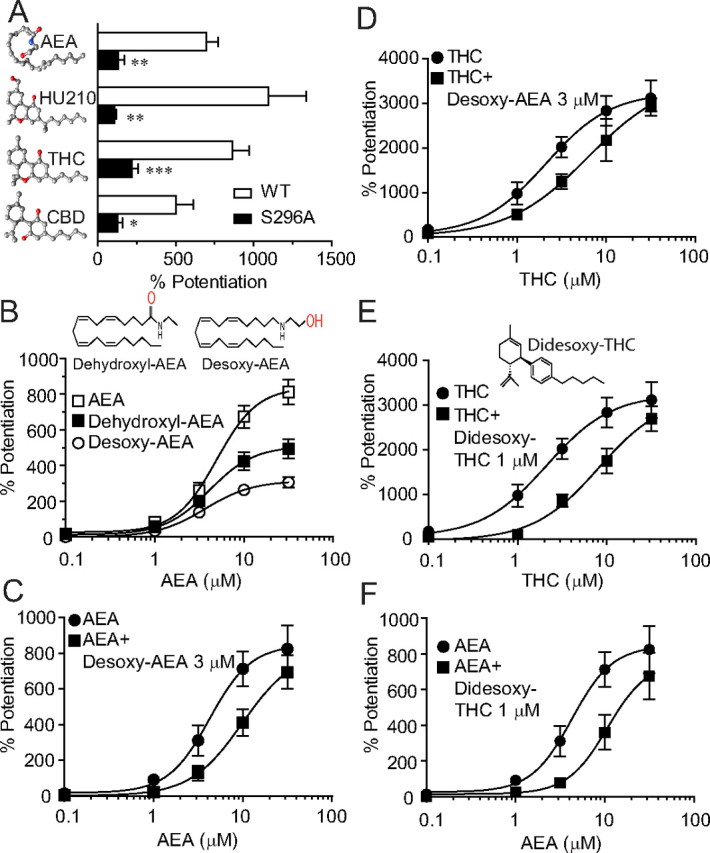
Desoxy-AEA shows reduced efficacy in potentiating IGly and antagonizes both AEA and THC-induced potentiation. A, The effects of AEA (10 μm), HU-210 (1 μm), THC (1 μm) and CBD (1 μm) on IGly activated by an EC2 concentration of Gly (10 μm) in cells expressing the S296A mutant and wild-type α1 GlyRs. n = 5–8, *p < 0.05, **p < 0.01, ***p < 0.001, one-way ANOVA followed by Dunnett's post hoc test against wild-type. B, The concentration–response curves for the AEA and modified AEA (dehydroxyl-AEA and desoxy-AEA)-induced potentiation in HEK-293 cells expressing the α1 GlyRs (n = 5–6). C, The concentration–response curves of the AEA potentiation without (solid circles) and with (solid squares) coapplication of desoxy-AEA. (n = 4–6). D, The concentration–response curves for THC potentiation without (solid circles) and with (solid squares) coapplication of desoxy-AEA. (n = 5–8). E, The concentration–response curves for THC potentiation without (solid circles) and with (solid squares) coapplication of didesoxy-THC (n = 5–8). F, The concentration–response curves for AEA potentiation without (solid circles) and with (solid squares) coapplication of didesoxy-THC (n = 5–7). The error bars that are not visible are smaller than the size of symbols.