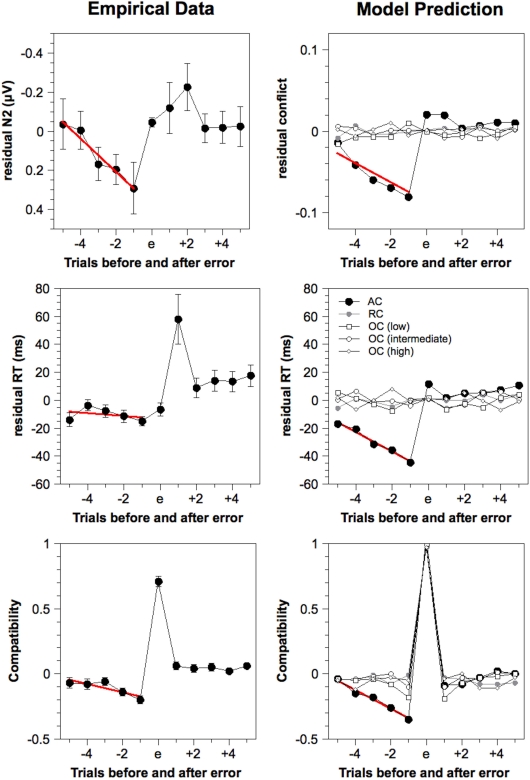
Figure 5.
Residual estimated N2 amplitudes, residual response times, and compatibility around errors for the empirical and model data, as obtained by de-convolution analysis. Simulated N2 amplitude is estimated by the cumulated pre-response conflict in each trial. Red lines indicate linear regression across five trials preceding errors (only provided for the AC model). ms, milliseconds, AC, Adaptive Control, RC, Random Control, OC, Oscillating Control.

