
Figure 2.
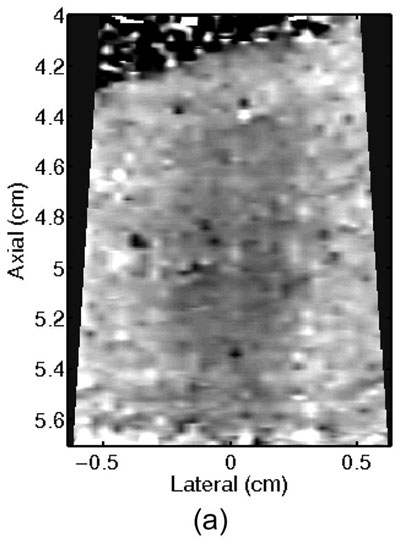
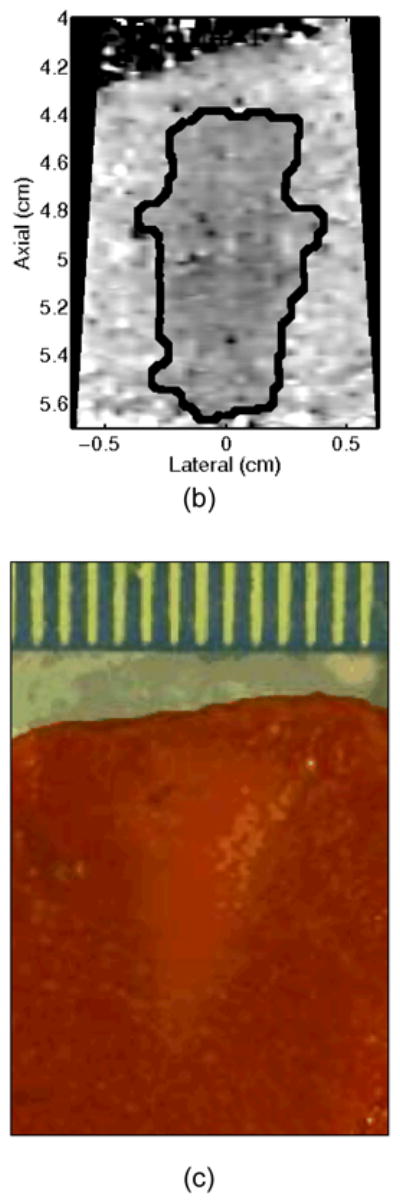
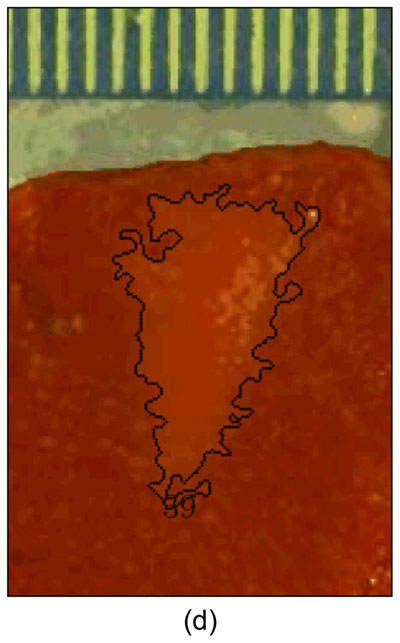
A single elementary spot lesion created with 120 s of HIFU (1283 W/cm2, 5.6 μs pulses at a PRF of 11.3 kHz with a transmit frequency of 4.44 MHz) insonification. ARFI image acquisitions were interspersed every 5 seconds to monitor lesion growth during ablation. a) The ARFI image after 115 s of heating. Focal gain compensation through depth has been applied to this image. Part of the water path is visible in the upper left. b) The image in a) with the semi-automated segmented lesion boundaries outlined in black. c) The corresponding gross pathology photograph for this lesion. d) The image in c) with the semi-automated segmented lesion boundaries outlined in black. For scale, a metric ruler (mm markings visible) is shown at the top of the pathology photographs.