
Figure 3.


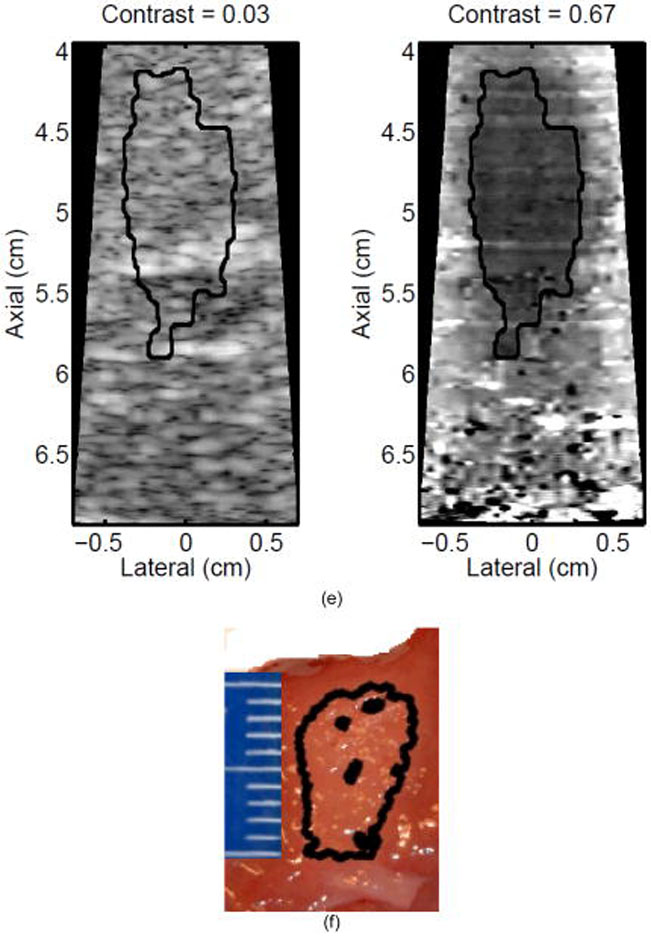
B-mode (left) and ARFI (right) images showing the growth of an ablation lesion as increasing numbers of spatially offset adjacent elementary spots are insonified (1100 W/cm2, 5.6 μs pulses at 11.3 kHz PRF with a transmit frequency of 4.44 MHz for 60 s segments at each spot). Semi-automated lesion boundaries are outlined in black. Elementary spots were offset from one another by 0.5 mm laterally or 2 mm in elevation. a) Before any heating, b) One spot, c) 3 spots offset in elevation, d) 3×3 (lateral × elevation) grid of spots, and e) 7×3 grid of spots. Focal gain compensation through depth has been applied to all of these images. (All images are displayed with the same dynamic range.) Red and yellow rectangles in b) indicate the regions over which contrast was calculated. The ARFI image for the 7×3 grid (e) indicated a lesion area of 0.82 cm2, which was in good agreement with the gross pathology (f) area of 0.68 cm2 for this large, high-contrast lesion.