
Figure 4.

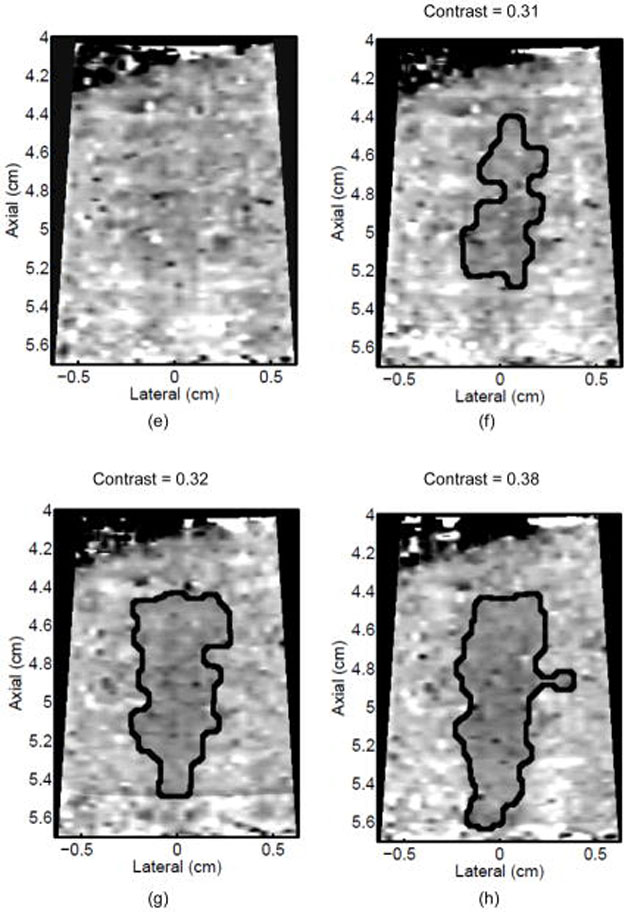
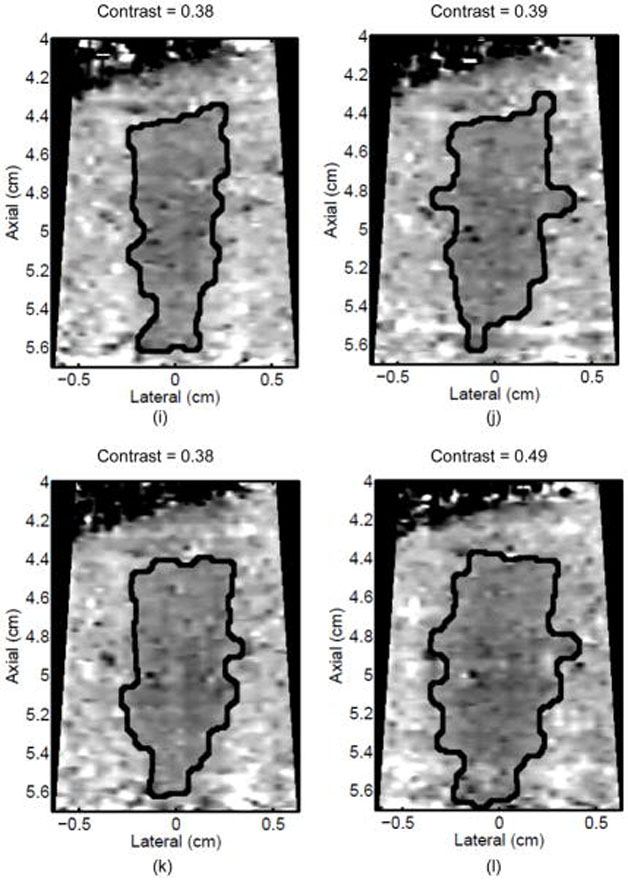
ARFI images taken immediately before the start of HIFU ablation in a single elementary spot (a total of 120 s of heating using 1283 W/cm2, 5.6 μs pulses at 11.3 kHz PRF with a transmit frequency of 4.44 MHz) and then at 10-s intervals interspersed during the ablation (a-0 s, b-10 s, c-20 s, d-30 s, e-40 s, f-50 s, g-60 s, h-70 s, i-80 s, j-90 s, k-100 s, l-110 s) are shown. Focal gain compensation through depth has been applied to all of these images. (All images are displayed with the same dynamic range.) Red and yellow rectangles in b) indicate the regions over which contrast was calculated. Part of the water path is visible in the upper left. The segmented lesion boundary is outlined in black.