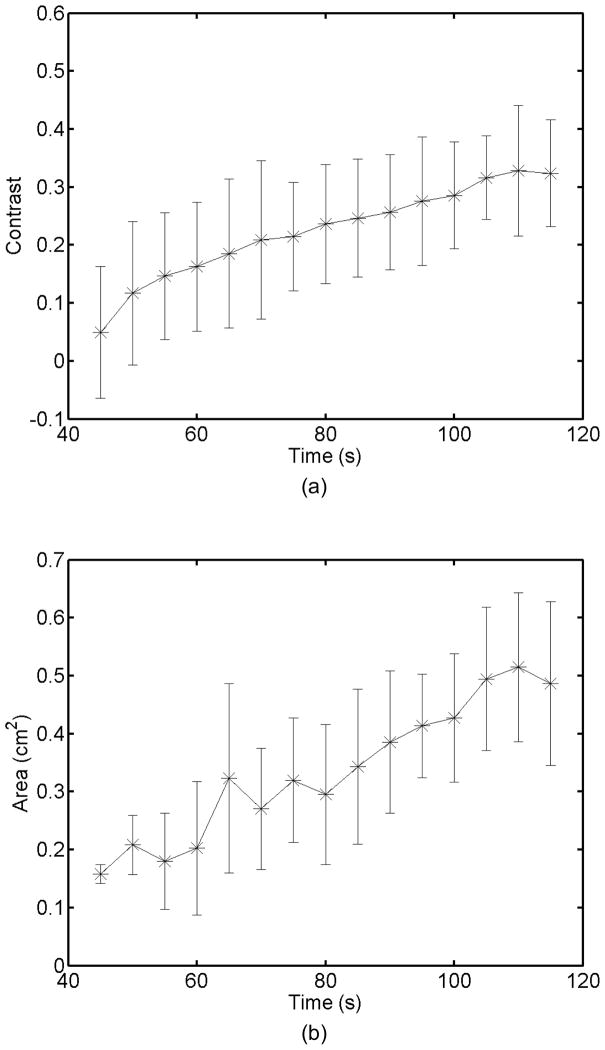
Figure 5.
a) Mean and standard deviation of the ARFI contrast of 5 ablation lesions formed as that shown in Fig 4, with the same HIFU and ARFI sequences at depths of 6.8 ± 2.2 mm in the liver. b) Corresponding segmented areas of the developing ablation lesions during the duration of the ablation.

