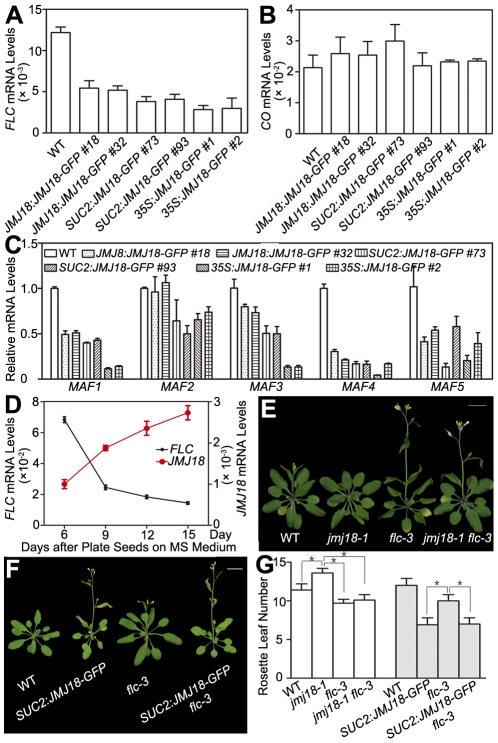
Figure 7. JMJ18 acts as a repressor of FLC and MAFs.
(A) FLC expression was repressed in the JMJ18 overexpressor lines. Asterisks indicate the significant difference between wild-type and transgenic plants analyzed by Student's t test (P<0.05). (B) CO expression was not obviously changed in the JMJ18 overexpressor lines. There was no significant difference between wild-type and transgenic plants analyzed by Student's t test (P<0.05). (C) The expression of MAF1 to MAF5 was repressed in the JMJ18 overexpressor lines. Eleven-day-old plants were used for RNA isolation. Asterisks indicate the significant difference between wild-type and transgenic plants analyzed by Student's t test (P<0.05). The expression level was normalized to that of ACTIN in (A) to (C). (D) Temporal expression patterns of FLC and JMJ18 during vegetative development. The mRNA levels were normalized to that of ACTIN. The error bars indicate the standard deviation from three independent biological replicates. (E) to (G) Genetic analysis of JMJ18 and FLC in flowering time control. The SUC2:JMJ18-GFP #73 was crossed to flc-3. Twenty-eight- (E) and 24-day-old (F) plants were photographed. Bar = 2 cm. Asterisks indicate the significant difference analyzed by Student's t test (P<0.05).

