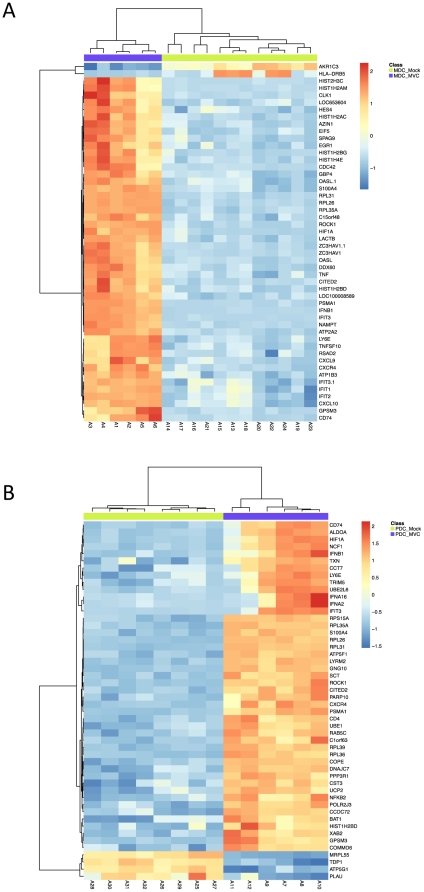
Figure 2. Genes induced by MVA-C in human mDCs and pDCs.
A) Gene expression heatmap using the top 50 differentially expressed genes resulting from comparing myeloid DCs infected with MVA-C (MDC_MVC) and mock-infected (MDC_Mock) groups. B) Gene expression heatmap using the top 50 differentially expressed genes resulting from comparing plasmacytoid DCs infected with MVA-C (PDC_MVC) and mock-infected (PDC_Mock) groups. Genes selected as differentially expressed based on the following criteria: adjusted p-value<0.05 and |FC|>1.3. The scale shows the level of gene expression where Red and Blue correspond to up- and down-regulation respectively.

