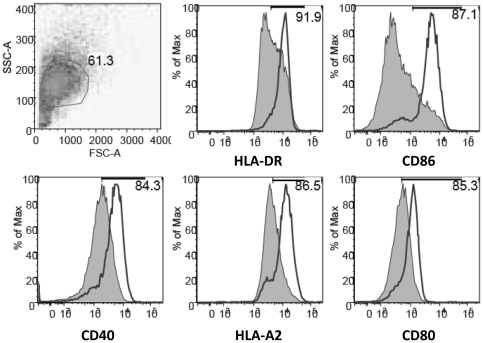
Figure 5. MVA-C induces maturation of human moDCs.
Cells were infected with 5 pfu/cell and expression of different membrane surface markers was determined by flow cytometry at 24 h.p.i. The shaded graphs represent cells infected with a parental WT strain. Mean fluorescence intensity is indicated in the plots. Data are representative of at least five independent experiments.

