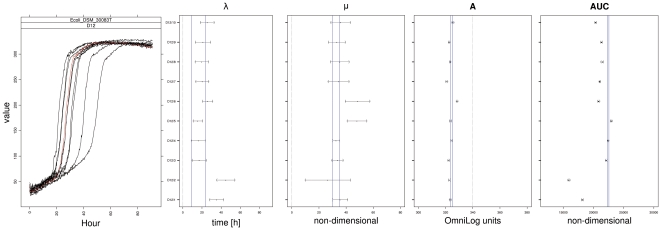
Figure 5. Comparison of curve-parameter point estimates and their 95% CIs for each of the four parameters lag phase (λ), slope (μ), maximum (A) and area under the curve (AUC), estimated for ten technical repetitions of respiration on well D12.
Left, a plot of the raw respiration data illustrates their courses individually for each of the ten repetitions. The red curve (D12/4) was used as an exemplar for demonstrating the detection of significant differences via CIs. In the right panel, point estimates and 95% CIs for each of the four parameters from the spline approach are given for each replication. The blue lines highlight the position of the upper and lower limit of CIs from D12/4's parameters. A non-overlap of the CIs of different curves indicates a difference of a statistically detectable amount, and the distance between two intervals provides information about the expected minimum difference.

