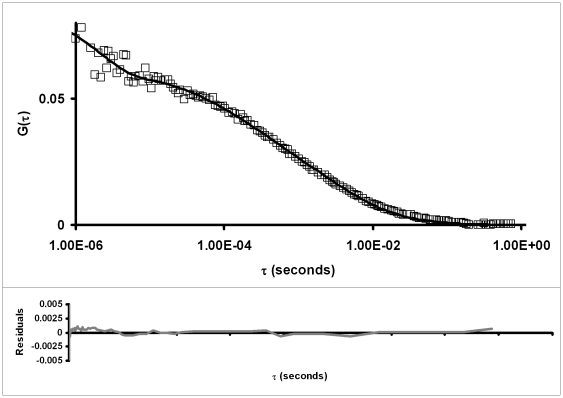
Figure 3. Auto-correlation curves of eGFP-Cdc45.
The figure shows typical auto-correlation curves of eGFP-Cdc45 (□) in asynchronous HeLa S3 cells stably expressing eGFP-Cdc45. In the upper panel the solid black line corresponds to a two-component free diffusion model and in the lower panel the gray line is the residual of the fit.

