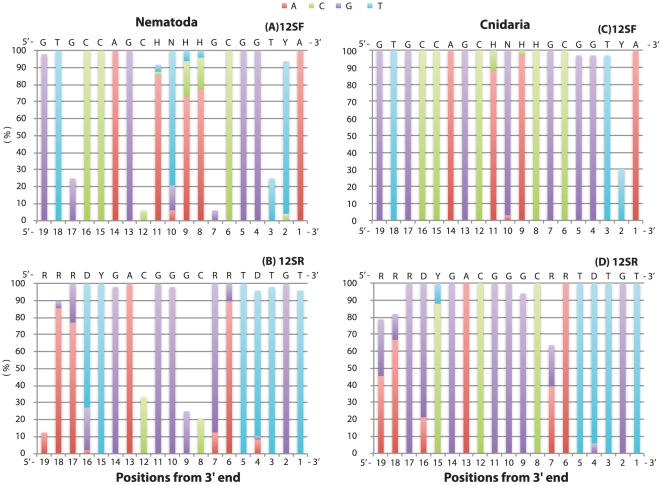
Figure 2. Nucleotide composition of the primer target regions observed in Nematoda (A and B) and Cnidaria (C and D).
Sequences of the primers are indicated on top of each figure. The nucleotides that matched with the primers are shown stacked in each column. Position of each site from 3′ to 5′ is indicated on bottom from left to right.

