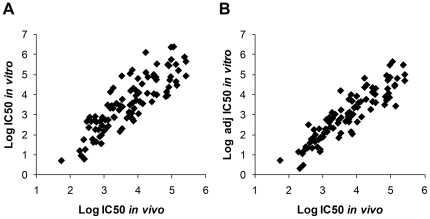
Figure 4. Scatter plot presenting in vivo LogIC50 (nM) versus in vitro LogIC50 (nM) adjusted (B) or not (A) for enzyme efficiency.
All data extracted from table 3 and adjusted for amount of enzyme used in the sensitivity test in panel B. Adjustment was performed using enzyme efficiency data extracted from table 4 following a simple equation: if percent efficiency is denoted by E then the efficiency adjusted IC50 = observed IC50×E/100. Following this adjustment the correlation was improved for all compounds.

