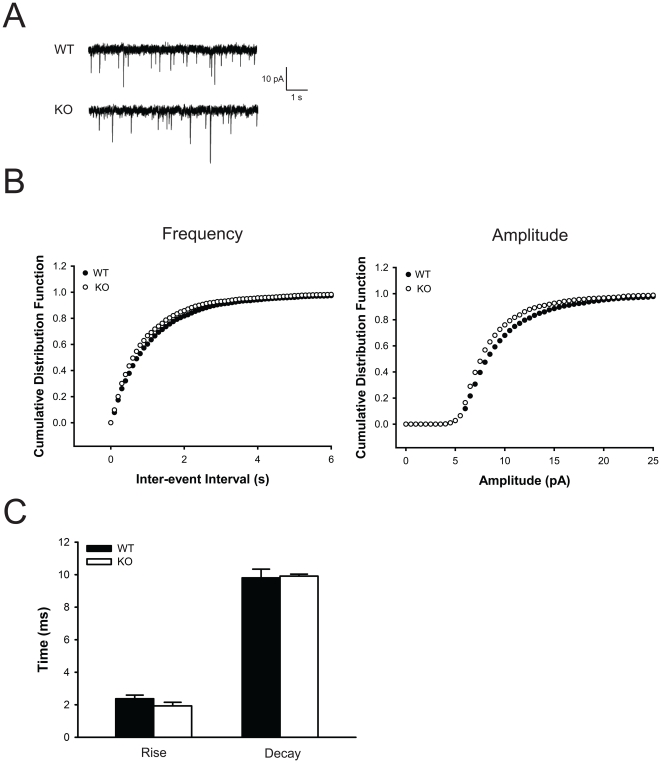
Figure 4. Hippocampal CA1 electrophysiological whole-cell recordings.
(A) Representative traces of mEPSC recording from WT and Btbd9 mutant mice. (B) Btbd9 mutant mice showed a decrease in both frequency and amplitude of mEPSC events compared to WT mice (p<0.01 each). (C) Btbd9 mutant mice showed no difference from WT in rise and decay times of mEPSC events. Bars represent means ± SEM.

