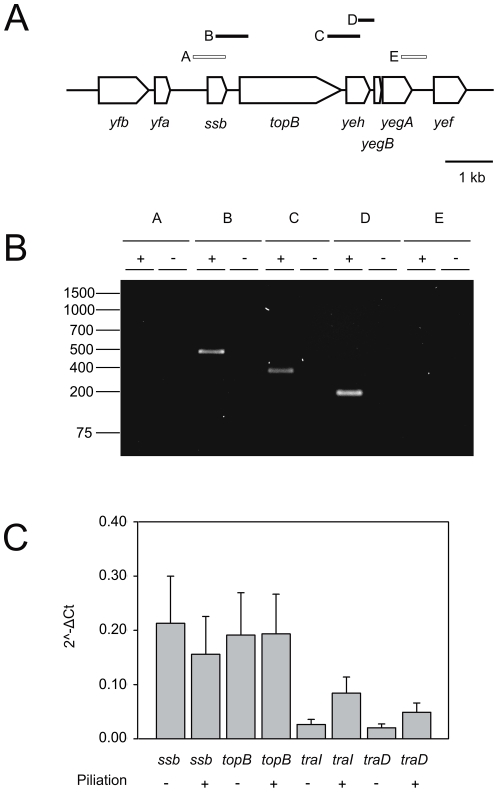
Figure 2. Analysis of the transcription of the yfa-yef region.
Reverse transcriptase was used to map the operon structure of the ssb-yegA region within the GGI of N. gonorrhoeae strain MS11. A) Schematic representation of the yfa-yef region of the GGI. Genes are indicated by arrows and the expected PCR products by lines over the genes. Primer combinations for which a PCR product was obtained are indicated by black boxes and primer combinations for which no PCR product was obtained are indicated by white boxes. B) Operon mapping of the ssb-yegA operon. Transcripts were determined by PCR. (+) indicates reactions on cDNA created in the presence of reverse transcriptase and (−) indicates reactions on cDNA created in the absence of reverse transcriptase. C) Quantitative gene expression levels of ssbB, topB, traI and traD of piliated and non-piliated N. gonorrhoeae strains were determined by qRT-PCR. The graph shows the mRNA levels as comparative gene expression after normalizing each gene to secY. Values depict means ± standard deviation of six biological replicates.

