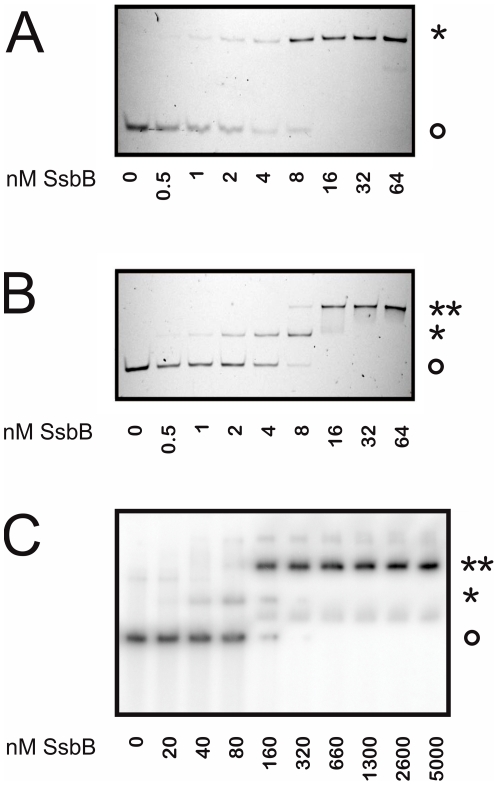
Figure 3. Analysis of the binding mode of SsbB by electrophoretic mobility shift assays.
A) 8 nM of fluorescently labeled dT35 and B) dT75 oligonucleotides were incubated in SBA buffer (10 mM NaOH, 2 mM EDTA, pH 7.5) with increasing concentrations (0–64 nM) tetrameric SsbB. The reactions were separated by polyacrylamide gel electrophoresis and were visualized using a LAS-4000 imager (Fujifilm). C) 2 nM of a 32P- labeled dT75 oligonucleotide was incubated with increasing concentrations (0–5000 nM) tetrameric SsbB in SBA buffer. The reactions were separated by polyacrylamide gel electrophoresis and were visualized by autoradiography. The circle (o) indicates the free oligonucleotide, while one (*) or two (**) asterixes represent oligonucleotides bound with one or two SsbB tetramers.

