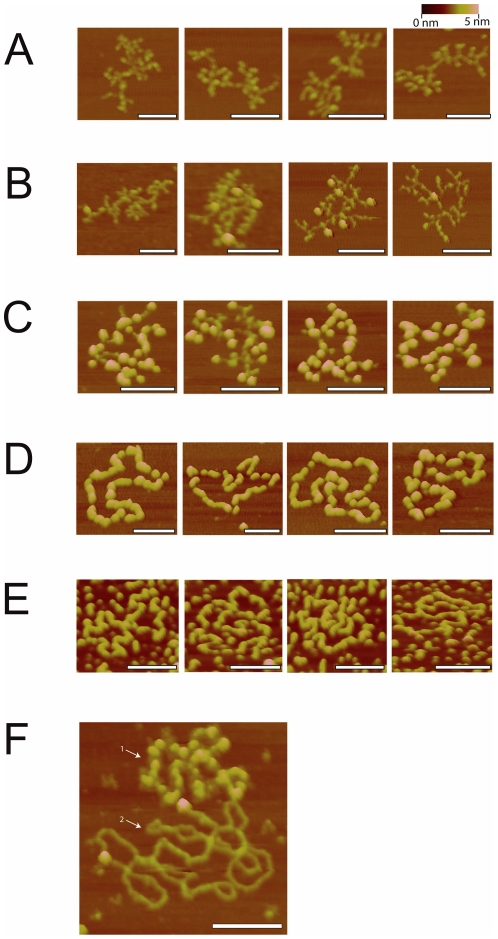
Figure 6. SsbB binding to M13 ssDNA visualized by Atomic force microscopy.
A selection of AFM images, zoomed to display one DNA molecule or complex per image. The scale bar in all pictures equals 100 nm. These images were made for SsbB-ssDNA complexes at concentration ratios (R, corresponding to tetramer/nucleotides) of (A) 0, (B) 1/707, (C) 1/354, (D) 1/88 and (E) 1/44. (F) SsbB binds only to ssDNA (indicated by 1) and not to dsDNA (indicated by 2). The two bound proteins on the dsDNA are probably not SsbB, as indicated by their larger apparent volume, but impurities present in the M13 preparation.

