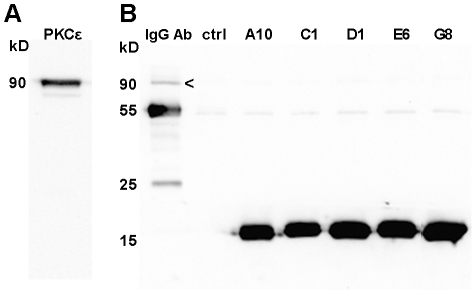
Figure 3. PKCε in rat brain extract.
(A) 15 µg of rat brain extract was separated on a SDS-PAGE gel. PKCε was detected with anti-PKCε and HRP-conjugated goat anti-mouse antibodies. (B) Immunoprecipitations were performed with rat brain extract using a commercial anti-PKCε antibody (IgG Ab) and VHHs. PKCε (marked with an arrowhead) is visible at 90 kDa on lane 1. The bands at 55 kDa and 25 kDa on lane 1 represent the heavy and light chains of the anti-PKCε antibody. The bands at 16 kDa for A10, C1, D1, E6 and G8 represent the VHHs. A sample of uncoated protein A sepharose beads was included as a negative control (lane 2 = ctrl).

