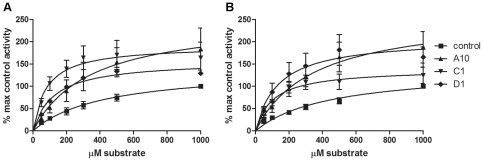
Figure 4. Kinetics of PKCε activation by VHHs A10, C1 and D1.
The kinase activity of full-length PKCε in the presence (A) and absence (B) of PKC activators DOG and PS was measured with varying MARCKS substrate concentrations. The VHH concentration was constant (1 µg/well) for each experiment. The data is presented as percentage maximal control activity (control activity with 1000 µM substrate) ± SEM and represents at least 3 independent experiments, each with duplicates. Note that the Vmax values for the VHHs have not been reached yet, see table 2 for analysis.

