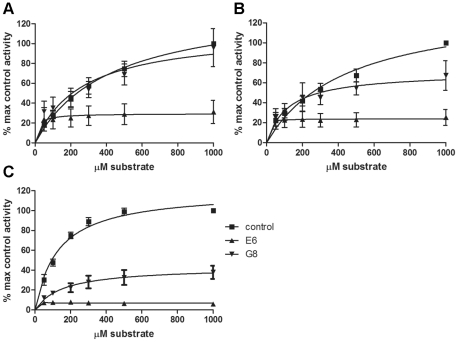
Figure 5. Kinetics of PKCε inhibition by VHHs E6 and G8.
(A–B) The kinase activity of full-length PKCε in the presence (A) and absence (B) of PKC activators DOG and PS was measured with varying MARCKS substrate concentrations. (C) The kinase activity of the catalytic domain of PKCε was measured with varying MARCKS substrate concentrations. The VHH concentration was constant (1 µg/well) for each experiment. The data is presented as percentage maximal control activity (control activity with 1000 µM substrate) ± SEM and represents at least 3 independent experiments, each with duplicates. The catalytic domain activity (C) with G8 is an exception with only 2 independent experiments with duplicates.

