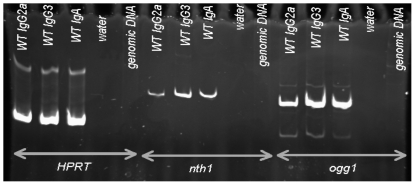
Figure 1. RT-PCR for Ogg1 and Nth1 mRNA demonstrates that these genes are expressed in activated WT splenic B cells.
Splenic B cells were treated for 2 days as described in Methods in order to induce CSR to IgG3, IgG2a, or IgA. The lanes are labeled as to the isotype to which the cells were induced to switch. Lanes labeled “water" have no template; “genomic DNA" is from mouse B cells. The hprt cDNA segment is ∼250 bp, the nth1 segment is 391 bp, and the ogg1 segment is 355 bp.

