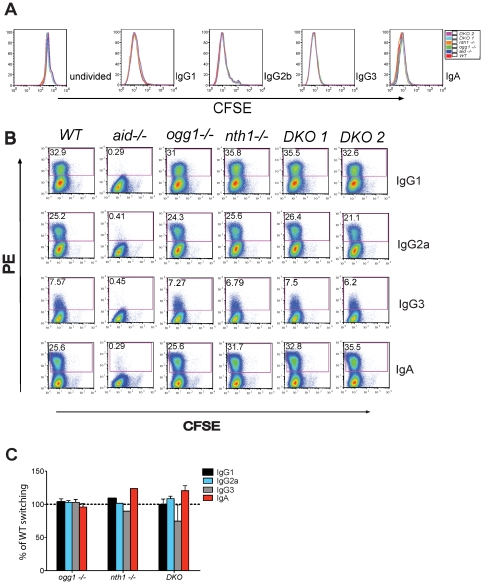
Figure 3. Ig class switching and proliferation of splenic B cells are not reduced in glycosylase-deficient mice.
(A) Splenic B cell proliferation as assayed by dilution of CFSE assayed ∼44 hrs after treatment to switch to the indicated isotypes. (B) Flow cytometry results showing surface isotype expression (Y-axis) vs CFSE fluorescence (X axis) in cells induced to switch to the indicated isotypes for ∼44 hr. The % of the cells expressing the switched isotype are indicated within the gates. (C) Summaries of the flow cytometry data normalized to WT CSR in each experiment. The numbers of mice used are WT, 5 mice; aid −/−, 1; ogg1 −/−, 5; nth1 −/− 1, DKO, 2.

