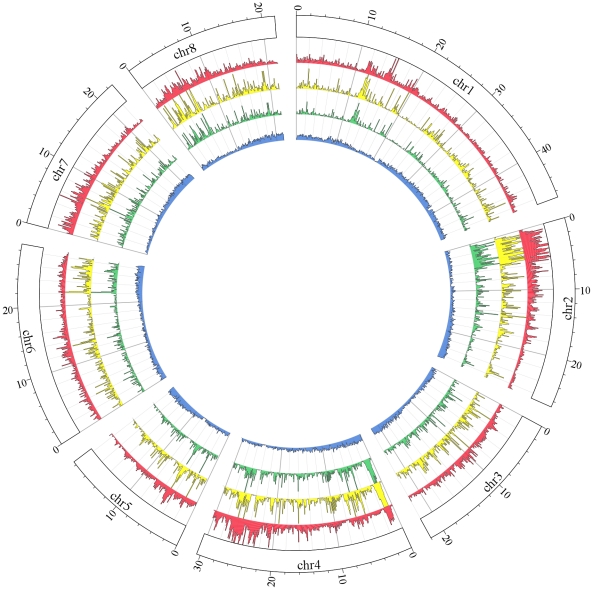
Figure 2. Distribution of SNPs along the Peach v1.0 pseudomolecules.
All tracks are plotted in 100 kb windows; inner blue track represents the frequency of coding DNA sequence CDS; y axis ranges from 0 to 100%. Red, yellow and green tracks represent, respectively, absolute number of SNPs discovered within pool 1–5, 40,789 Stage 2 SNPs in exons, and 9,000 SNPs chosen for the array; values in the y axes are capped at 2000, 100, and 30, respectively.

