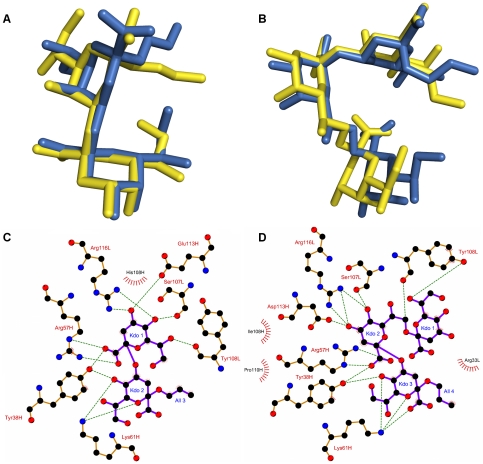
Figure 2. Evaluation of molecular docking using high resolution crystal structure complexes.
A. Comparison of top ranked pose obtained from molecular docking (yellow) with the crystallographic binding mode (blue) of the Kdoα(2→4)Kdoα(2-OAll):S25-39 complex (PDB 3OKK). B. Comparison of top ranked pose (yellow) obtained from molecular docking with the crystallographic binding mode (blue) of the Kdoα(2→8)Kdoα(2→4)Kdoα(2-OAll):S73-2 complex (PDB 3HZV). C. Schematic representation of interactions in the Kdoα(2→4)Kdoα(2-OAll):S25-39 predicted by molecular docking. D. Schematic representation of interactions in the Kdoα(2→8)Kdoα(2→4)Kdoα(2-OAll):S73-2 complex. Molecular docking carried out using GOLD 4.1.1. Figures 2A and 2B prepared using PyMOL [64]. Figures 2C and 2D prepared using LIGPLOT [65]. Legend to Figures 2C and 2D: hydrogen bonds – green dashes; hydrophobic interactions – red arcs; carbon – black; oxygen – red; nitrogen – blue; ligand bonds – purple; protein bonds – orange.

