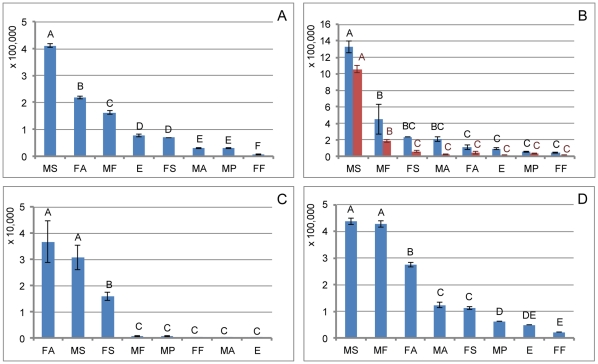
Figure 7. Absolute quantification analysis of the genes involved in wax biosynthesis during different developmental stages.
A, Absolute quantification analysis of ELO1; B, Absolute quantification analysis of FAR3 (blue bars) and FAR1 (red bars); C, Absolute quantification analysis of WS1; D, Absolute quantification analysis of ABC1. The same letters are not significantly different, P>0.01. MS: male second-instar larvae, the peak time of wax secretion; MF: male first-instar larvae; MP: male pupae; MA: male adults; FF: female first-instar larvae; FS: female second-instar larvae; FA: female adults; E: eggs.

