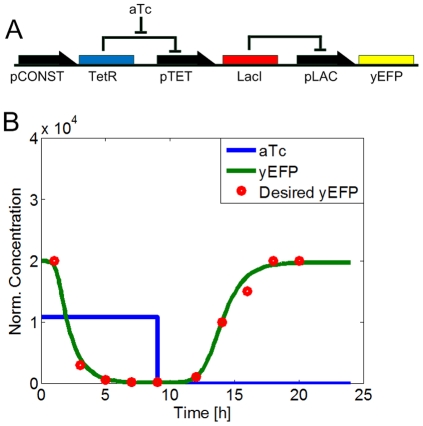
Figure 3. Transcriptional cascade design.
A) The system is controlled by the inducer aTc which can bind to TetR and reduce the concentration of free TetR molecules. This concentration change will be propagated through the cascade to the change of the reporter yEFP. B) Temporal profile of a cascade design: The desired output (yEFP, red dots) and the actual output (green line) of the optimal synthetic gene circuit are showed. The temporal profile was split into two phases, based on changes in the inducer concentration. In the first phase (0 h–9 h), 2.16  aTc (blue line) is added and in the second phase (9 h–24 h) aTc is washed out (setting as the experiment in [24]).

