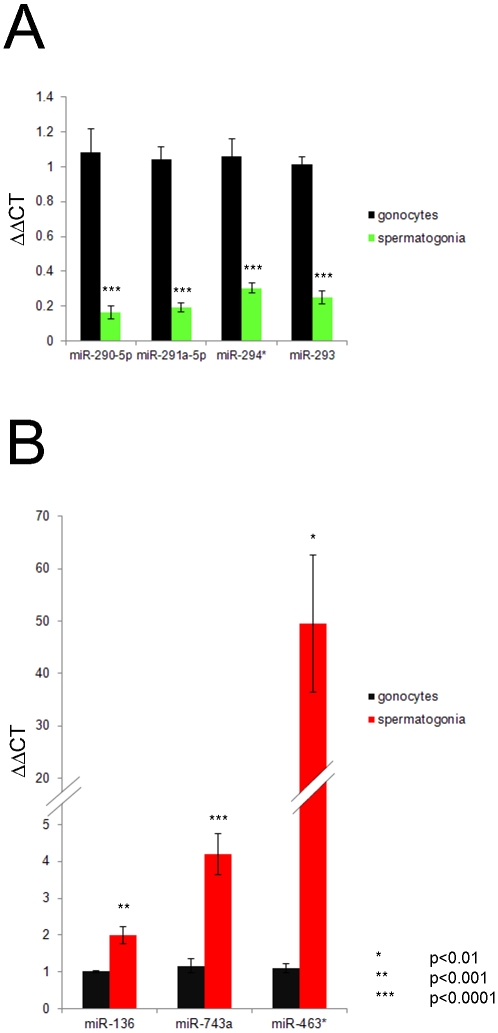
Figure 3. Confirmation of miRNA microarray analysis using qPCR.
Total RNA from isolated germ cell populations (five biological replicates) was reverse transcribed with specific primers and specific miRNA molecules were amplified by QPCR. The resultant data was analysed using the 2e-ΔΔT calculation to determine the expression in spermatogonia relative to gonocytes. A) All the down-regulated miRNA (miR-293, 291a-5p, 294* and 290-5p (green)) identified by the SAM analysis in Figure 2 were found to be expressed in spermatogonia at approximately 20% of the level they were in gonocytes (p<0.0001). B) All the down-regulated miRNA (miR-136, 743a and 463* (red)) identified by SAM were found to be expressed at significantly higher levels in spermatogonia than in gonocytes. miR-136 was up-regulated 2 fold (p<0.001), miR743a was up-regulated 4 fold (p<0.0001) while miR-463* was up-regulated 50 fold (p<0.01).

