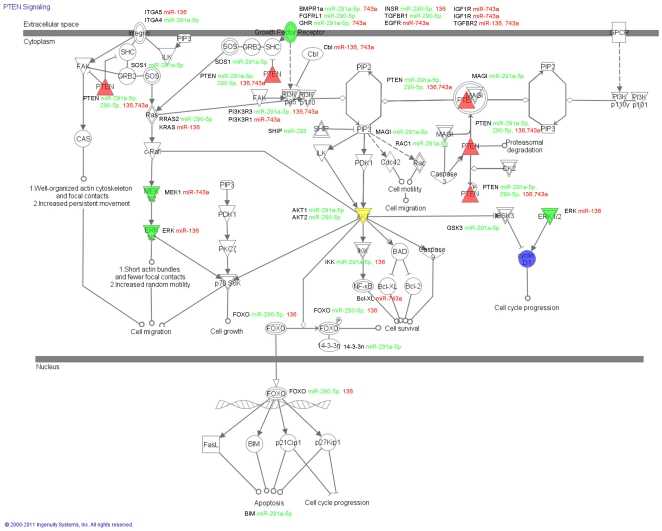
Figure 6. The PTEN signalling pathway.
The PTEN signalling pathway was chosen from the pathways identified in the IPA analysis (Figure S2) for closer examination. The signalling pathway was outlined in IPA and the genes targeted by miRNA molecules are identified on the pathway alongside their targeting miRNA molecules (red unregulated in spermatogonia, green down-regulated in spermatogonia). Targets examined for gene and protein expression levels are colour coded according to their expression in gonocytes and spermatogonia, up-regulated molecules red, unchanged molecules yellow and down-regulated molecules green. In the PTEN pathway the expression of PTEN, AKT, ERK and MEK remained unchanged between gonocytes and spermatogonia while the expression of the growth receptor BMPR1a was significantly reduced in spermatongia when compared to gonocytes. The target protein Cyclin D1 is identified by blue highlighting.

