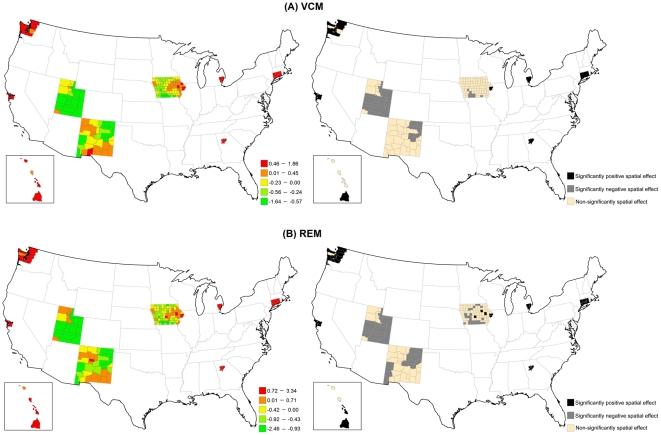
Figure 8. Maps for structured spatial function in the VCM and REM for breast cancer mortality.
(Left) Estimated structured spatial effect, where the range was categorized by 5-quantiles. (Right) 80% posterior probabilities, where black colour means significantly positive spatial effect, grey colour means significantly negative spatial effect, and tan colour means non-significantly spatial effect.

