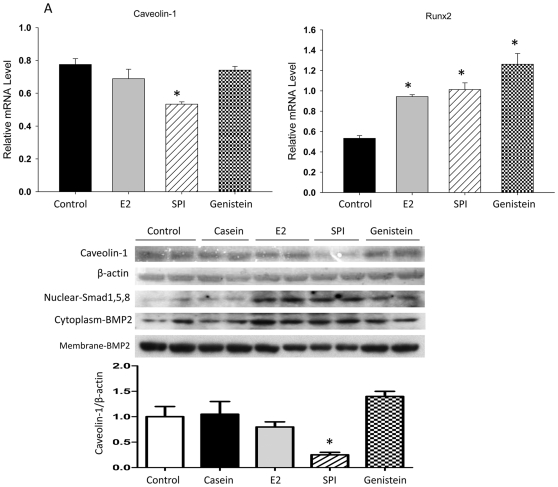
Figure 6. SPI stimulates osteoblast differentiation via down-regulation of caveolin-1.
ST2 cells were treated with 2% serum either from control, 10 µg/kg/d E2 treated, SPI diet rats and 5 µM of purified genistein for 48 h. RNA and protein were collected. (A), Real-time PCR showing relative caveolin-1 and Runx2 mRNA expression. Data are Means ± SEM, triplicates, * p<0.05 versus control. (B), Western blotting showing caveolin-1 protein, nuclear SMD and cytosolic versus membrane BMP2 expression. Quantitation of the intensity of the caveolin-1 in the autoradiograms was performed relative to expression of β-actin.

