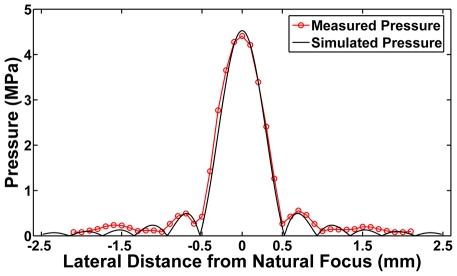
Figure 2. Comparison of measured and simulated pressure distributions of the annular array.
Calculated pressure as function of distance derived from simulation of the 16 element annular array compared to the measured pressure in the lateral direction. The measured −6 dB beam width was 0.8 mm, which agreed well with simulated results.

