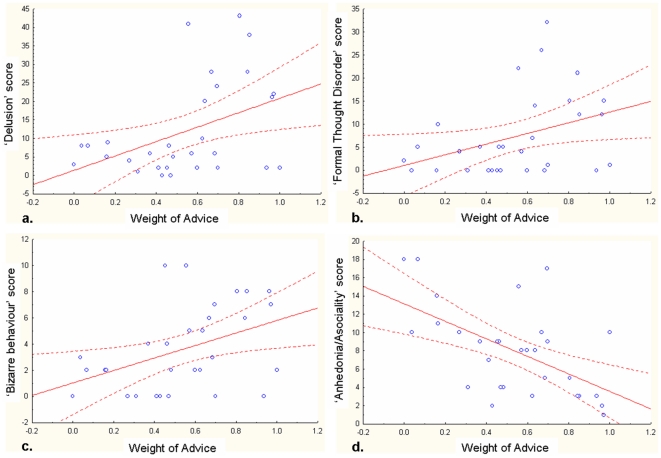
Figure 4. The Weight of Advice predicts the severity of clinical symptoms.
The linear regression lines derived from the linear regressions analyses between the Weight of Advice (explanatory factor) and patients’ symptoms are shown in red. The 95% confidence intervals for the regression lines are shown in grey. Note that the correlation is positive for SAPS subscores (a, b, c), and negative for the SANS subscore (d).

