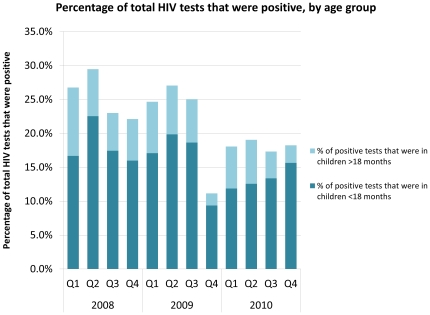
Figure 3. Percentage of total HIV tests that were positive, by age group.
Bar graph demonstrates, by quarter in a 36-month period (a) what proportion of total inpatient and outpatient children tested were identified HIV-infected, (b) what proportion of these children were under and over 18 months old.

