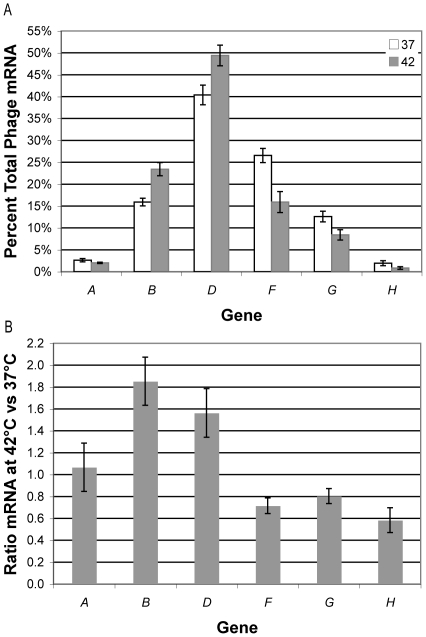
Figure 2. Transcript levels of six φX174 genes measured 4 min post ejection.
A. Proportion (%) each gene contributed to the total phage mRNA in a sample averaged over six samples for growth at 37°C and 42°C. Error bars are ±1 standard error. B. Ratio of the absolute quantity of each gene at 42°C to 37°C averaged over six samples. Error bars are ±1 standard error.

