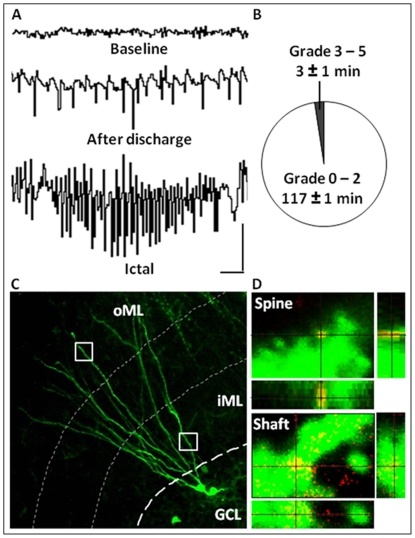
Figure 1. Inclusion criteria and methodology.
A, EEG recordings from electrode-implanted animals showing baseline activity (top) before stimulations in the hippocampus, high-frequency ictal activity immediately following a stimulation period (afterdischarge) during the one hour of induction of status epilepticus (SE) (middle), and high-frequency ictal activity during the two hours post-stimulation period of self-sustained SE (bottom). B, Pie chart showing the time spent in partial (grade 0–2) and generalized seizures (grade 3–5) according to the Racine scale. C, Photomicrograph showing a representative GFP+ dendritic tree of an adult-born neuron extending into the molecular layer (ML) of the dentate gyrus. Cluster analyses on the GFP+ dendrites were carried out in two regions of interest of the dendritic tree, the inner and outer ML (iML and oML, respectively, marked by squares) to reflect different synaptic inputs onto the new cells. D, Orthogonal reconstructions from confocal z-series, viewed in x-z (bottom) and y-z (right) planes, were used to confirm co-localization of clusters on GFP+ dendrites, as shown here with a PSD-95 cluster on a dendritic spine (top) and a gephyrin cluster on the dendritic shaft (bottom). Calibration is 2 s and 1 mV (A). Scale bars are 20 µm (C) and 1 µm (D).

