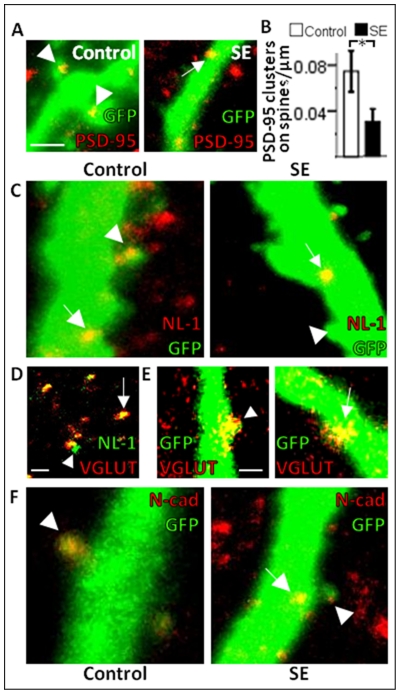
Figure 4. Six-week-old neurons formed after a pSE insult show decreased scaffolding protein expression but unaltered expression of adhesion molecules important at excitatory synapses.
Representative photomicrographs of PSD-95 (A), NL-1 clusters (C), and N-cadherin (F), on GFP+ dendritic spines (arrow heads) and shafts (arrows). Note the distribution of NL-1 clusters mainly on the dendritic shaft. B, Cluster density of PSD-95 expression on dendritic spines (iML and oML pooled). D, Image showing co-localization of NL-1 clusters with VGLUT1 (arrow) in ML confirming the presence of NL-1 at excitatory synapses. A few clusters did not co-localize (arrow head). E, Images showing VGLUT1 located on a spine (arrow head) and on the dendritic shaft (arrow) of GFP+ dendrites. Means ± SEM, n = 5 control and n = 4 pSE group *, P<0.05 unpaired t-test compared to control group. Scale bars are 1 µm (in A for A, C, F and in D and in E).

