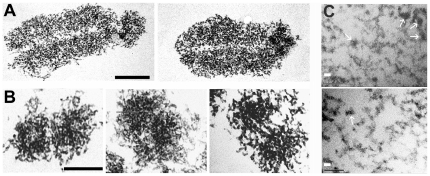
Figure 2. Images by transmission electron microscopy of chromosomes released in 12% PEG.
Sections are approximately longitudinal or transversal in (A) and (B), respectively. (C) Chromatin fibres in regions of lower density at the periphery of chromosomes; white arrows illustrate regions where fibres of ∼30 nm diameter are seen. Scale bars (A, B), 1 µm; (C), 30 nm.

