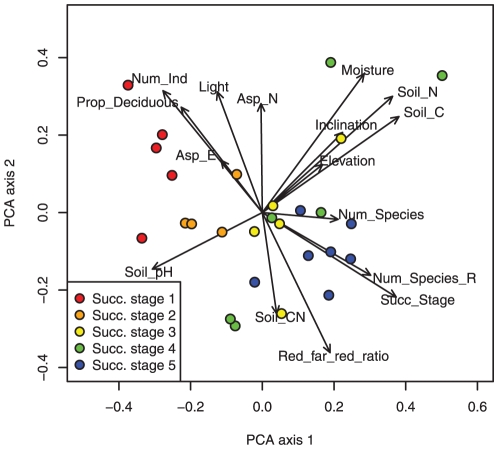
Figure 3. Principal component analysis (PCA) analysing the covariation of all 16environmental variables across all sites (CSPs).
Biplot of PCA scores of the first and second axis. The different colours show the successional stages (1: <20 yr, 2: <40 yr, 3: <60 yr, 4: <80 yr, 5: ≥80 yr). Abbreviations of environmental variables: Succ_Stage = Successional stage, Num_Species = Species richness, Num_Species_R = Rarefied species richness, Num_Ind = Number of individuals per plot, Prop_Deciduous = Proportion of deciduous individuals, Soil C = Soil carbon content, Soil N = Soil nitrogen content, Soil CN = Soil C/N ratio, Moisture = Mean soil moisture, Asp_E = Eastness = Sine (aspect), Asp_N = Northness = Cosine (aspect), Light = Mean relative intensity of PAR, Red_far_red_ratio = Mean red∶far-red ratio.

