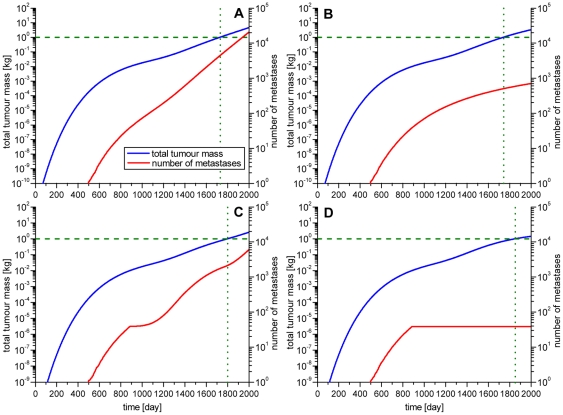
Figure 6. The development of total tumour weight and number of metastases in time.
To compare the different scenarios in terms of relevance for the patient the total tumour mass (blue line), including the primary tumour and all metastases, was computed. The value of the lethal tumour mass of 1 kg is marked with a dashed line. The number of metastases (red line) was also visualized in the graph. The tumour mass is mapped to the left y-axes and the number of metastases to the right y-axes. The day on which primary tumour and metastases reach the total mass of 1 kg is marked with a green dotted line. Again four different scenarios were simulated: A) Metastases are able to metastasize. B) Metastases are not able to metastasize. C) Primary tumour and metastases metastasize only until they reach a size of 1010 cells. Metastases are able to metastasize. D) Primary tumour and metastases metastasize only until they reach a size of 1010 cells. Metastases are not able to metastasize.

