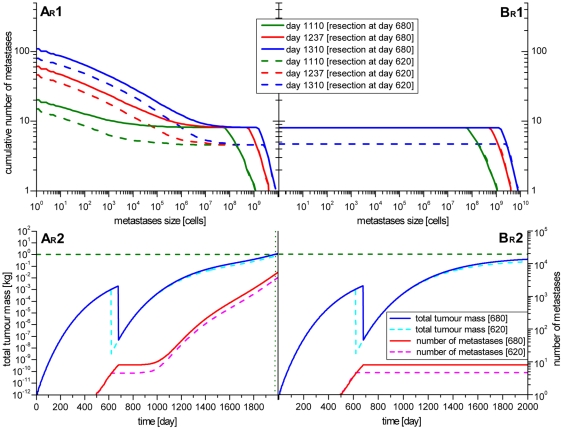
Figure 7. Simulated resection of the primary tumour.
The resection of the primary tumour was simulated for two different time points. The first time point is shortly after the initial diagnosis at day 680 (solid lines). The second time point is some time before the first diagnosis at day 620 (dotted lines) simulating early diagnosis e.g. as a result of tumour screening. The cumulative number of metastases according to the size of the metastases (graphs AR1 and BR1) and the development of the tumour mass and the number of metastases in time (graphs AR2 and BR2) are shown. After the resection no new metastases are founded for some time. In scenarios AR the number of metastases starts rising again after some time. The time of death could be shifted to 244 days (resection at day 680) or 290 days (resection at day 620) into the future. In scenario BR no new metastases are founded after the resection. The existing metastases keep growing, but never reach the benchmark value of 1 kg.

