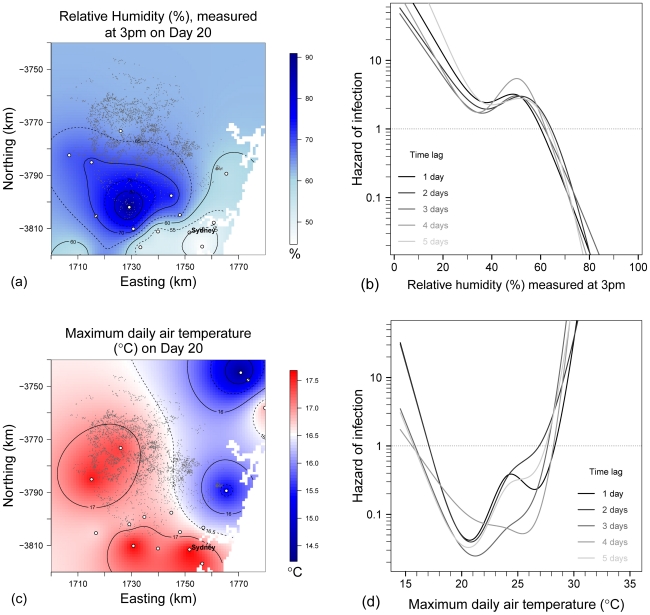
Figure 5. Smoothing of daily meteorological data and estimation of the association with premises-level hazard of infection in the largest cluster of the 2007 outbreak of equine influenza in Australia.
Daily meteorological data provided by Australian Bureau of Meteorology weather stations (white closed circles) were smoothed using kriging, and time-lagged by 1–5 days. (a) Smoothed estimate of relative humidity measured at 3 pm on Day 20 of the outbreak. Small grey dots denote the horse premises. (b) Restricted cubic splines of the crude relationship between hazard of infection and relative humidity (3 pm measurement) at time-lags of 1–5 days over the entire study period. (c) Smoothed daily maximum air temperature on Day 20 and (d) the relationship between daily maximum air temperature and hazard of infection, by time lag.

