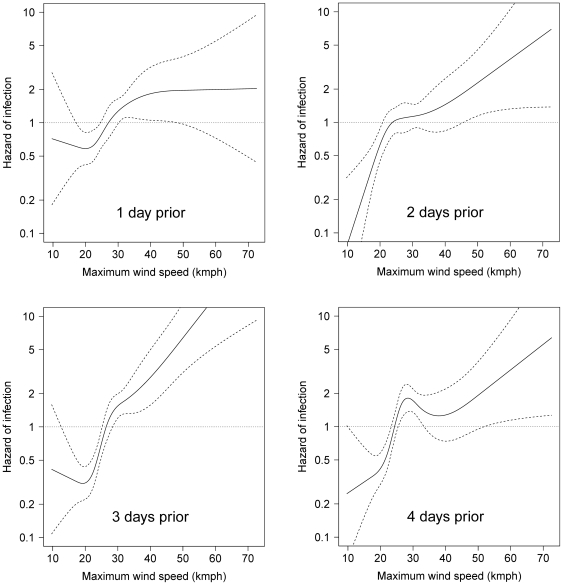
Figure 6. The crude relationship between hazard of infection and maximum daily wind speed, from all directions, in the largest cluster of the 2007 outbreak of equine influenza outbreak, by time lag.
Estimates are based on hourly wind data from all directions and time-lagged by 1–4 days. Dashed lines represent 95% confidence intervals.

