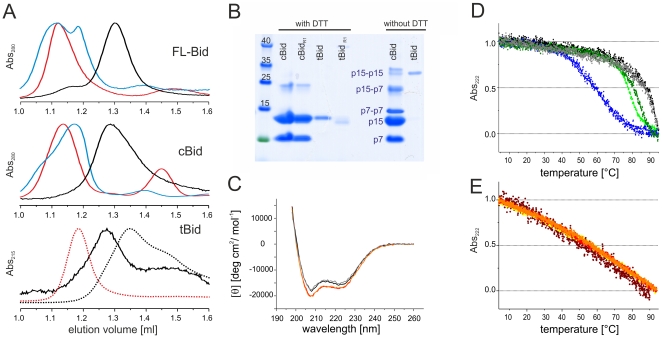
Figure 2. Oligomerization and structural stability of Bid.
A. SEC chromatograms (Superdex 75 column) of FL-Bid, cBid and tBid. Black curves, soluble proteins; dark cyan, 2% OG; red, 1% DDM. For tBid the elution profile in the presence of DTT is also shown (dotted lines). B. SDS PAGE of cBid and tBid (before and after spin labeling) in the presence and absence of DTT. C. CD spectra of soluble and detergent-incubated (1% DDM) FL-Bid (black and red, respectively); soluble and detergent-incubated (1% DDM) cBid (gray and orange, respectively). D. Normalized melting curves of the Bid variants. Black and gray, soluble FL-Bid and FL-BidR1, respectively; light and dark green, soluble cBid and cBidR1, respectively; blue, soluble tBid. E. Normalized melting curves of the Bid variants in the presence of 1% DDM. Red, FL-Bid; orange and yellow, cBid and cBidR1, respectively; brown, tBid.

