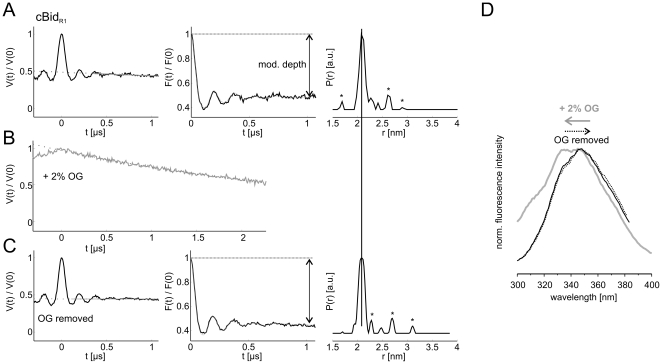
Figure 4. Reversibility of the cBid dissociation at different protein concentrations.
(A) Normalized DEER traces V(t), normalized form factors F(t) and distance distributions obtained with the software DeerAnalysis2010 of cBidR1 in the absence of detergent (A), in the presence of 2% OG (B, only V(t) is presented), and after removal of detergent by extensive dialysis (C). Asterisks denote noise-related artefacts in the distance distribution. Protein concentration 180 µM. (D) Tryptophan and tyrosine (Y47, W48, Y185) fluorescence spectra of cBidR1 detected after excitation at 280 nm in the absence of detergent (black), in the presence of 2% OG (gray), and after removal of detergent by extensive dialysis (dotted black). Protein concentration 0.5 µM.

