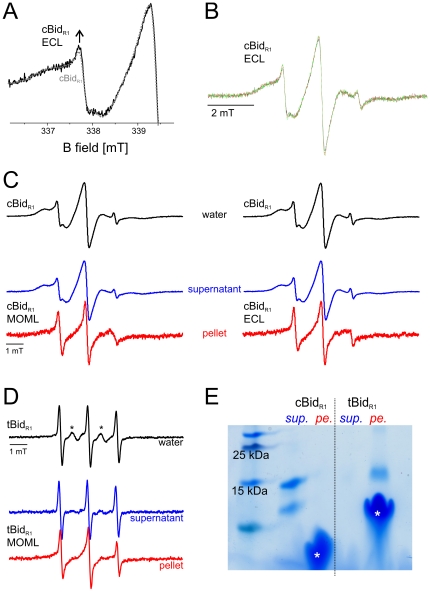
Figure 5. Bid-membrane interactions.
A. Low field region of the EPR spectra of cBidR1 detected at 37°C in buffer (protein concentration 40 µM, dotted grey) and after 2 minutes incubation (black) of 3.5 µL cBidR1 (40 µM) with 4.5 µL ECL liposomes (lipid concentration 4.5 mg/ml). The arrow highlights the small increase in spin label mobility. B. Spectra of cBidR1 in the presence of ECL liposomes after 2 minutes (black), 3 h (red) and 16 h (green) incubation. C. Intensity normalized spectra of cBidR1 in water (black). Spectra detected in the supernatant fraction (blue) and in the washed pellet fraction (red) after 3 h incubation of 50 µL cBidR1 (110 µM) with 50 µL ECL or MOML liposomes (20 mg/ml lipids) at 37°C. The same results were reproduced with 4 times higher lipid to protein ratio (not shown). D. EPR spectrum of tBidR1 in water (black). Asterisks denote a small fraction of residual unbound MTSSL biradical in solution. Spectra detected in the supernatant fraction (blue) and in the washed pellet fraction (red) after 3 h incubation of 20 µL tBidR1 (50 µM) with with 50 µL MOML liposomes (20 mg/ml lipids). The spectrum in the supernatant is assigned to the residual MTSSL free in solution. E. SDS PAGE of cBidR1 and tBidR1 in the supernatant fraction (sup.) and in the washed pellet fraction (pe.). The left lane shows the reference molecular weights, asterisks denote the liposome bands. Silver staining of this gel showed some cBid in the pellet fraction as well as some tBid in the supernatant fraction (data not shown).

