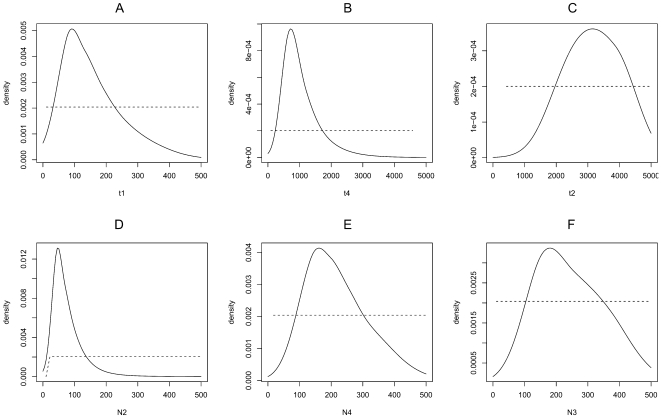
Figure 4. Prior and posterior distributions density curves for different estimators of Tetranychus evansi introduction events, calculated under scenario 7 (the most likely scenario of invasion);
a) t1: the divergence time between eastern African (AF) and European (EU) populations; b) t4: between Mediterranean (MED) and eastern African (AF) populations; c) t2: between (BR-SW) and (AF) populations; d) N2; e) N4 and f) N3: estimates of the propagule size for introductions in AF, MED and EU respectively. Geographical codes as in Table 1. Y-axis: probability density of estimated parameters. The dotted and solid lines correspond to the prior and posterior density curves, respectively. The best estimates of parameters occur where the posterior probability density function peaks.

